Figure 1 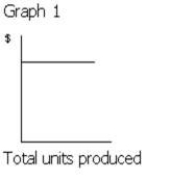
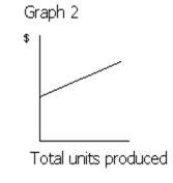
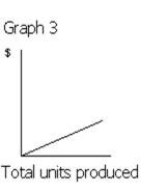
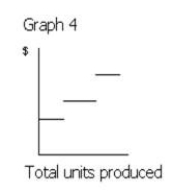
-Which of the following graphs in Figure 1 illustrates the nature of a mixed cost?
A) Graph 2
B) Graph 3
C) Graph 4
D) Graph 1
Correct Answer:
Verified
Q62: Figure 1 Q63: Which of the following activity bases would Q63: Which of the following is not an Q65: Most operating decisions of management focus on Q67: The three most common cost behavior classifications Q67: Costs that vary in total in direct Q68: The graph of a variable cost when Q71: Costs that remain constant in total dollar Q74: For purposes of analysis, mixed costs are Q76: Which of the following costs is an![]()
A)
Unlock this Answer For Free Now!
View this answer and more for free by performing one of the following actions

Scan the QR code to install the App and get 2 free unlocks

Unlock quizzes for free by uploading documents