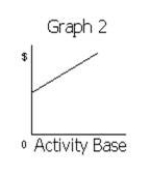
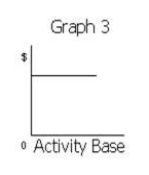
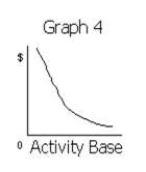
Match each of the following costs with the graph (a-e) that best portrays its cost behavior as the number of units produced and sold increases. 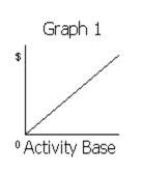
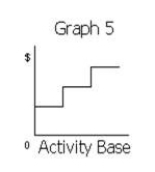
-Total salaries of quality control supervisors (One supervisor must be added for each additional work shift.)
A)Graph 1
B)Graph 2
C)Graph 3
D)Graph 4
E)Graph 5
Correct Answer:
Verified
Q190: Match each of the following costs with
Q191: Match each of the following costs with
Q192: Match each of the following costs with
Q193: Match each of the following descriptions with
Q194: Match each of the following costs of
Q196: Match each of the following costs with
Q197: Match each of the following costs with
Q198: Match each of the following costs of
Q199: Match each of the following costs with
Q200: Match each of the following costs with
Unlock this Answer For Free Now!
View this answer and more for free by performing one of the following actions

Scan the QR code to install the App and get 2 free unlocks

Unlock quizzes for free by uploading documents