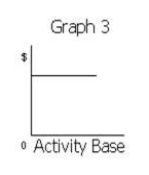
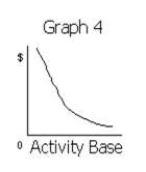
Match each of the following costs with the graph (a-e) that best portrays its cost behavior as the number of units produced and sold increases. 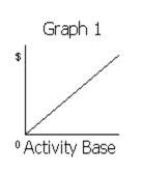
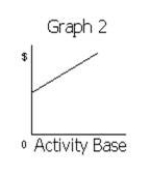
-Electricity costs of $5,000 per month plus $0.0004 per kilowatt-hour
A)Graph 1
B)Graph 2
C)Graph 3
D)Graph 4
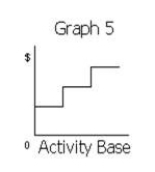
E)Graph 5
Correct Answer:
Verified
Q191: Match each of the following costs with
Q192: Match each of the following costs with
Q193: Match each of the following descriptions with
Q194: Match each of the following costs of
Q195: Match each of the following costs with
Q197: Match each of the following costs with
Q198: Match each of the following costs of
Q199: Match each of the following costs with
Q200: Match each of the following costs with
Q201: Blane Company has the following data:
Unlock this Answer For Free Now!
View this answer and more for free by performing one of the following actions

Scan the QR code to install the App and get 2 free unlocks

Unlock quizzes for free by uploading documents