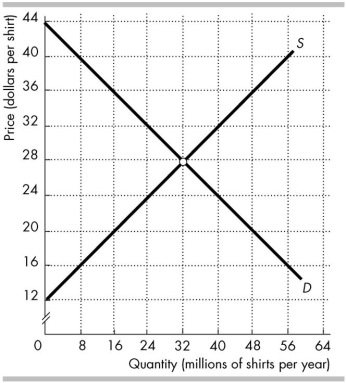
 The figure above shows the market for shirts in Australia, where D is the Australian demand curve and S is the Australian supply curve. The world price is $20 per shirt. Australia imposes a tariff on imported shirts of $4 per shirt.
-In the figure above, the tariff _______ Australian imports of shirts by _______ million shirts per year.
A) decreases; 8
B) decreases; 16
C) increases; 4
D) increases; 8
Correct Answer:
Verified
Q100: Q101: An import quota restricts _ and is Q102: In 2007, European Union (EU) negotiators offered Q103: The fundamental force that drives international trade Q104: Which of the following is an explanation Unlock this Answer For Free Now! View this answer and more for free by performing one of the following actions Scan the QR code to install the App and get 2 free unlocks Unlock quizzes for free by uploading documents![]()

