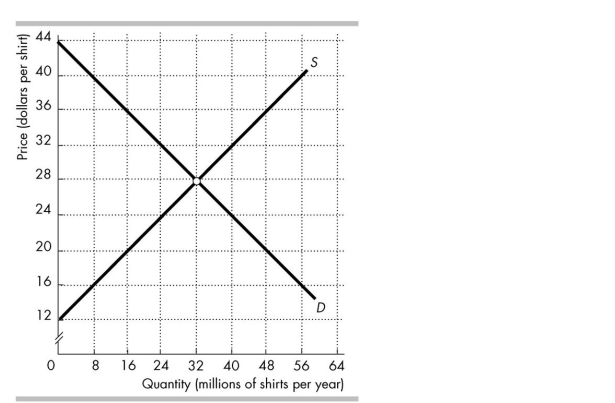
 The figure above shows the market for shirts in Australia, where D is the Australian demand curve and S is the Australian supply curve. The world price is $20 per shirt. Australia imposes a tariff on imported shirts of $4 per shirt.
-In the figure above, Australian producers' _______ from the tariff is _______ .
A) gain; $80 million
B) gain; $128 million
C) loss; $64 million
D) loss; $32 million
Correct Answer:
Verified
Q102: In 2007, European Union (EU) negotiators offered
Q103: The fundamental force that drives international trade
Q104: Which of the following is an explanation
Q105: Q106: Q108: Which of the following is a reason Q109: Suppose the world price of a good Q110: The infant- industry argument is based on Q111: Using calculations of the cost to Americans Q112: Unlock this Answer For Free Now! View this answer and more for free by performing one of the following actions Scan the QR code to install the App and get 2 free unlocks Unlock quizzes for free by uploading documents![]()
![]()
![]()

