Multiple Choice
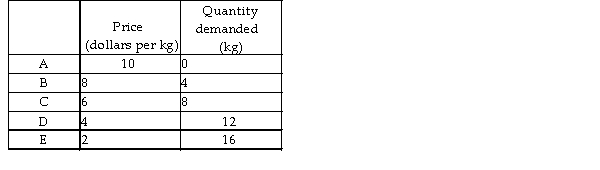
-The table above gives the demand schedule for peas. Between point A and point B, the price elasticity of demand equals
A) 9.
B) 0.22.
C) 0.50.
D) 0.11.
Correct Answer:
Verified
Related Questions
-The table above gives the demand schedule for peas. Between point A and point B, the price elasticity of demand equals
A) 9.
B) 0.22.
C) 0.50.
D) 0.11.
Correct Answer:
Verified

