Multiple Choice
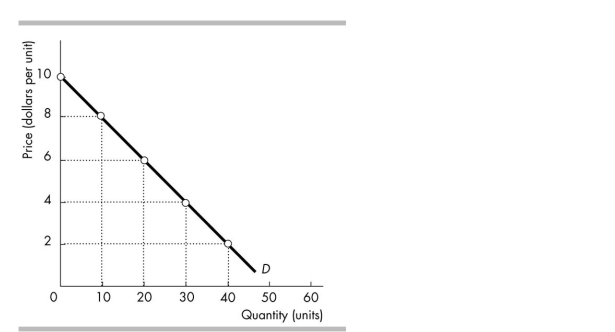
-The figure above illustrates a linear demand curve. By comparing the price elasticity in the $2 to $4 price range with the elasticity in the $8 to $10 range, you can conclude that the elasticity is
A) the same in both price ranges.
B) greater in the $2 to $4 range.
C) greater in the $8 to $10 range.
D) greater in the $8 to $10 range when the price rises but greater in the $2 to $4 range when the price falls.
Correct Answer:
Verified
Related Questions
Q118: If the income elasticity of demand for

