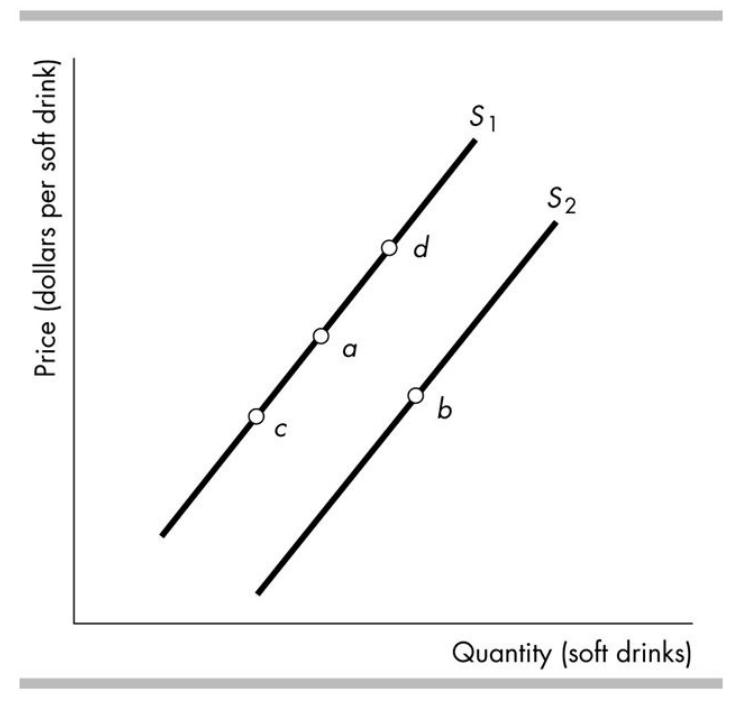
-The figure above shows supply curves for soft drinks. Suppose the economy is at point a. A movement to point b could be the result of
A) a decrease in the relative price of a soft drink.
B) an increase in the relative price of a soft drink.
C) an increase in the money price of a soft drink.
D) an increase in technology.
Correct Answer:
Verified
Q3: There is a technological advance in the
Q5: Normal goods are those for which demand
Q9: Q11: Q12: The interaction of supply and demand explains Q13: If good growing conditions increase the supply Q16: Wants, as opposed to demands, Q74: A decrease in the expected future price Q75: The quantity demanded of a good or Q398: Unlock this Answer For Free Now! View this answer and more for free by performing one of the following actions Scan the QR code to install the App and get 2 free unlocks Unlock quizzes for free by uploading documents![]()
![]()
A)
A) are the![]()

