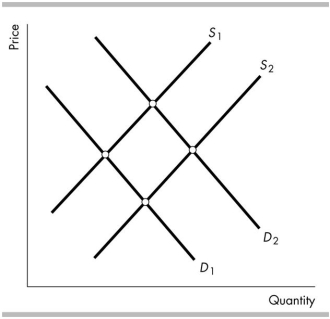
-The figure above shows the market for chocolate. People become more concerned that eating chocolate causes them to gain weight, which they do not like. As a result, the
A) demand curve shifts from D2 to D1 and the supply curve does not shift.
B) demand curve shifts from D2 to D1 and the supply curve shifts from S2 to S1.
C) demand curve does not shift, and the supply curve shifts from S1 to S2.
D) demand curve shifts from D1 to D2 and the supply curve shifts from S1 to S2.
Correct Answer:
Verified
Q5: Normal goods are those for which demand
Q8: Q11: Q12: The interaction of supply and demand explains Q13: If good growing conditions increase the supply Q14: Twenty years ago a stove cost $300 Q16: Wants, as opposed to demands, Q74: A decrease in the expected future price Q75: The quantity demanded of a good or Q398: Unlock this Answer For Free Now! View this answer and more for free by performing one of the following actions Scan the QR code to install the App and get 2 free unlocks Unlock quizzes for free by uploading documents![]()
![]()
A)
A) are the![]()

