Multiple Choice
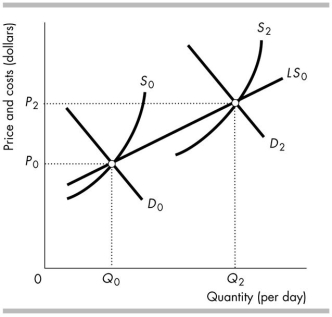
-The curve LS0 in the above figure is the long- run supply curve in a perfectly competitive market. The short- run market supply curve shifts from S0 to S2 as the
A) wage rate falls.
B) external economies rise.
C) number of firms increases.
D) number of firms decreases.
Correct Answer:
Verified
Related Questions
Q2: Q3: External economies and diseconomies explain the shape Q4: Q5: At a firm's break- even point, its Q6: In perfect competition, the marginal revenue of Q7: If a perfectly competitive market has external Unlock this Answer For Free Now! View this answer and more for free by performing one of the following actions Scan the QR code to install the App and get 2 free unlocks Unlock quizzes for free by uploading documents![]()
![]()
A)

