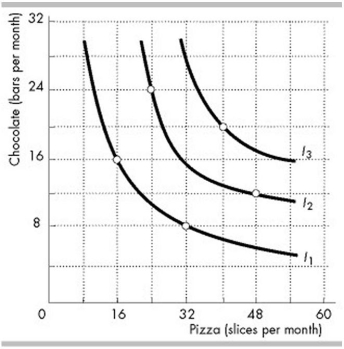
-The indifference curves in the figure above (I1, I2 and I3) reflect Peter's consumption preferences. Peter prefers consuming _______ to consuming _______.
A) 32 slices of pizza and 8 chocolate bars; 16 slices of pizza and 16 chocolate bars
B) 24 slices of pizza and 24 chocolate bars; 40 slices of pizza and 20 chocolate bars
C) 48 slices of pizza and 12 chocolate bars; 24 slices of pizza and 24 chocolate bars
D) 40 slices of pizza and 20 chocolate bars; 48 slices of pizza and 12 chocolate bars
Correct Answer:
Verified
Q139: Suppose that Dave has $200 to spend
Q140: Q141: Julie's demand curve for video downloads is Q143: Q145: Q146: Q147: Q148: Suppose that initially the price of a Q149: Which of the following statements is FALSE? Q243: Unlock this Answer For Free Now! View this answer and more for free by performing one of the following actions Scan the QR code to install the App and get 2 free unlocks Unlock quizzes for free by uploading documents![]()
![]()
![]()
![]()
![]()
A)![]()

