Listed below is the box plot of average earnings ratio for full-year, full-time female workers from 1999 to 2008. 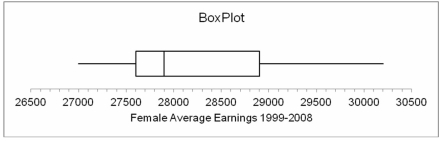 From this we can interpret that the distribution of average earnings for women for the years 1999-
2008 was:
A) Symmetrical
B) Positively skewed
C) Negatively skewed
D) Bimodal
E) Variable
Correct Answer:
Verified
Q96: Measures of dispersion calculated from grouped data
Q98: i. An outlier is a value in
Q100: The weights (in kilograms) of a group
Q101: Mr. and Mrs. Jones live in a
Q105: Listed below is the box plot of
Q106: A study of the scores on an
Q107: The coefficient of variation generally lies between
Q108: Listed below is the box plot of
Q111: What statistics are needed to draw a
Q117: A box plot shows
A) The mean and
Unlock this Answer For Free Now!
View this answer and more for free by performing one of the following actions

Scan the QR code to install the App and get 2 free unlocks

Unlock quizzes for free by uploading documents