Statistics Canada report 2010 results in the following chart. 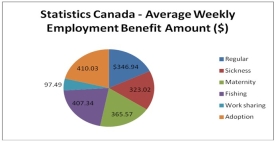 Is the data quantitative or qualitative? What is the name of the table shown?
A) quantitative, simple table
B) quantitative, pie chart
C) qualitative, frequency table
D) qualitative, pie chart
E) quantitative, bar chart
Correct Answer:
Verified
Q14: Using the frequency table below, determine the
Q15: (i) A frequency distribution is grouping of
Q16: Monthly commissions of first-year insurance brokers are
Q17: The chart below shows the Gross Domestic
Q18: If the enrolment for this Faculty of
Q20: (i) Pie charts are useful for showing
Q21: For the following distribution of heights, what
Q22: The chart below can be best described
Q23: The following class intervals for a frequency
Q24: The head of the statistics department wants
Unlock this Answer For Free Now!
View this answer and more for free by performing one of the following actions

Scan the QR code to install the App and get 2 free unlocks

Unlock quizzes for free by uploading documents