The chart below can be best described as 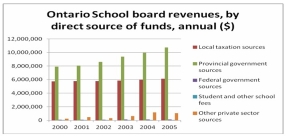
A) Line chart
B) Bar chart
C) Clustered bar chart
D) Stacked bar chart
E) Cumulative stacked bar chart
Correct Answer:
Verified
Q17: The chart below shows the Gross Domestic
Q18: If the enrolment for this Faculty of
Q19: Statistics Canada report 2010 results in the
Q20: (i) Pie charts are useful for showing
Q21: For the following distribution of heights, what
Q23: The following class intervals for a frequency
Q24: The head of the statistics department wants
Q25: The chart below can be best described
Q26: A sample distribution of hourly earnings in
Q27: Refer to the following distribution of commissions:
Unlock this Answer For Free Now!
View this answer and more for free by performing one of the following actions

Scan the QR code to install the App and get 2 free unlocks

Unlock quizzes for free by uploading documents