The chart below can be best described as 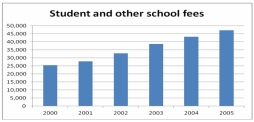
A) Line chart
B) Bar chart
C) Pie chart
D) Stacked bar chart
E) Cumulative stacked bar chart
Correct Answer:
Verified
Q20: (i) Pie charts are useful for showing
Q21: For the following distribution of heights, what
Q22: The chart below can be best described
Q23: The following class intervals for a frequency
Q24: The head of the statistics department wants
Q26: A sample distribution of hourly earnings in
Q27: Refer to the following distribution of commissions:
Q28: Refer to the following price of jeans
Q29: Consider the following relative frequency distribution:
Q30: The monthly salaries of a sample of
Unlock this Answer For Free Now!
View this answer and more for free by performing one of the following actions

Scan the QR code to install the App and get 2 free unlocks

Unlock quizzes for free by uploading documents