The following frequency distribution presents the frequency of passenger vehicles that pass through a certain intersection from 8:00 AM to 9:00 AM on a particular day.
Construct a relative frequency Parato chart for the data.
A) 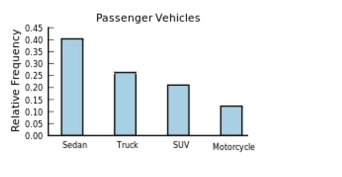
B) 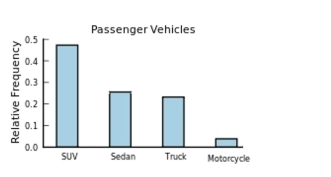
C) 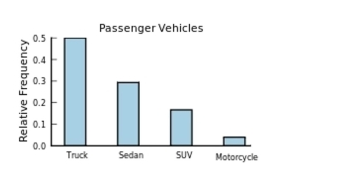
D) 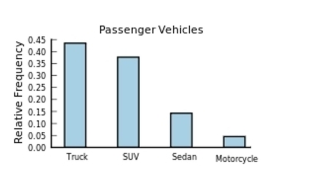
Correct Answer:
Verified
Q11: The following frequency distribution presents the
Q12: The following bar graph presents the average
Q13: The following frequency distribution presents the
Q14: One hundred students are shown an eight-digit
Q15: The following frequency distribution presents the
Q17: The following table presents the purchase
Q18: The following table presents the purchase
Q19: The following frequency distribution presents the weights
Q20: The following frequency distribution presents the
Q21: Which of the following presents the most
Unlock this Answer For Free Now!
View this answer and more for free by performing one of the following actions

Scan the QR code to install the App and get 2 free unlocks

Unlock quizzes for free by uploading documents