A relative frequency histogram for the sale prices of homes sold in one city during 2010 is shown below. Basedon the histogram, is a large sample necessary to conduct a hypothesis test about the mean sale price? If so,why? 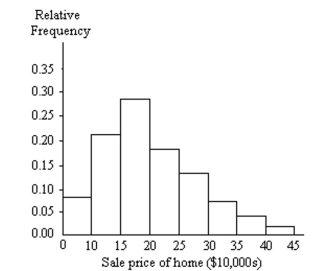
A) Yes; data do not appear to be normally distributed but skewed right.
B) Yes; data do not appear to be normally distributed but skewed left.
C) No; data appear to be normally distributed.
D) Yes; data do not appear to be normally distributed but bimodal.
Correct Answer:
Verified
Q70: In one city, 25 out of
Q71: Determine the critical value for a right-tailed
Q72: According to a national statistics bureau, 3.7%
Q73: Determine the critical values for a two-tailed
Q74: An event is considered unusual if the
Q76: Find the standardized test statistic t
Q77: The weights (in ounces) of a sample
Q78: Find the standardized test statistic t
Q79: A coin is tossed 1000 times and
Q80: Find the standardized test statistic t
Unlock this Answer For Free Now!
View this answer and more for free by performing one of the following actions

Scan the QR code to install the App and get 2 free unlocks

Unlock quizzes for free by uploading documents