The box plot shown below was constructed for the amount of soda that was poured by a filling machine into 12-ounce soda cans at a local soda bottling company. 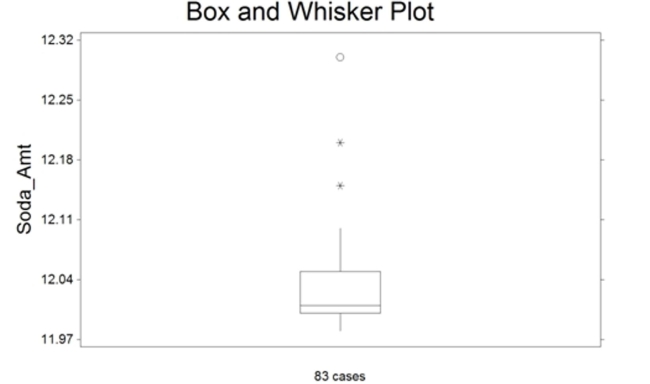
We see that one soda can received 12.15 ounces of soda on the plot above. Based on the box plot presented, how would you classify this observation?
A) it has a lot of soda
B) suspect outlier
C) highly suspect outlier
D) expected observation
Correct Answer:
Verified
Q2: The amount spent on textbooks for the
Q3: The payroll amounts for all teams in
Q4: The amount spent on textbooks for the
Q5: 252 randomly sampled college students were
Q6: What class percentage corresponds to a class
Q7: At the U.S. Open Tennis Championship a
Q8: The total points scored by a
Q9: A recent survey was conducted to compare
Q10: The amount spent on textbooks for the
Q11: The amount of time workers spend commuting
Unlock this Answer For Free Now!
View this answer and more for free by performing one of the following actions

Scan the QR code to install the App and get 2 free unlocks

Unlock quizzes for free by uploading documents