A least squares estimated regression line has been fitted to a set of data and the
Resulting residual plot is shown. Which is true? 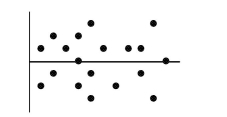
A) The linear model is appropriate.
B) The linear model is poor because some residuals are large.
C) The linear model is poor because the correlation is near 0.
D) A curved model would be better.
E) A transformation of the data is required.
Correct Answer:
Verified
Q3: The time series graph below shows annual
Q4: Stock prices and earnings per share (EPS)
Q5: Stock prices and earnings per share
Q6: The regression model developed to predict
Q7: Data were collected for a sample
Q9: Data were collected for a sample
Q10: Quarterly returns were forecasted for a mutual
Q11: A first-order autoregressive model, AR (1)
Q12: Data were collected for a sample
Q13: If the point in the upper left
Unlock this Answer For Free Now!
View this answer and more for free by performing one of the following actions

Scan the QR code to install the App and get 2 free unlocks

Unlock quizzes for free by uploading documents