The time series graph below shows annual sales figures (in thousands of dollars)
For a well known department store chain. Which model would be most appropriate for
Forecasting this series? 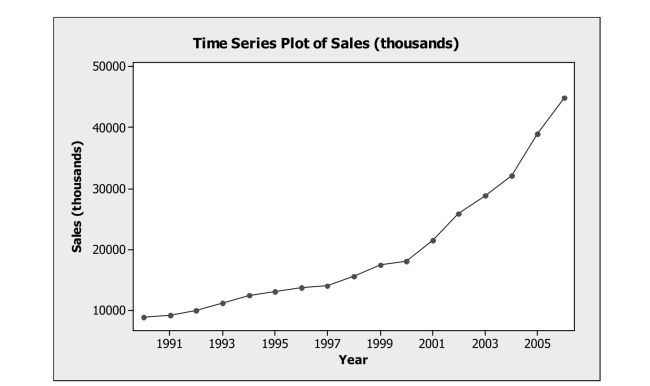
A) Moving Average
B) Single Exponential Smoothing
C) Quadratic Trend
D) Linear Trend
E) Seasonal Regression
Correct Answer:
Verified
Q1: Quarterly returns were forecasted for a mutual
Q2: Which statement about re-expressing data is not
Q4: Stock prices and earnings per share (EPS)
Q5: Stock prices and earnings per share
Q6: The regression model developed to predict
Q7: Data were collected for a sample
Q8: A least squares estimated regression line has
Q9: Data were collected for a sample
Q10: Quarterly returns were forecasted for a mutual
Q11: A first-order autoregressive model, AR (1)
Unlock this Answer For Free Now!
View this answer and more for free by performing one of the following actions

Scan the QR code to install the App and get 2 free unlocks

Unlock quizzes for free by uploading documents