A consumer research group investigating the relationship between the price of meat
(per pound) and the fat content (grams) gathered data that produced the following
scatterplot. 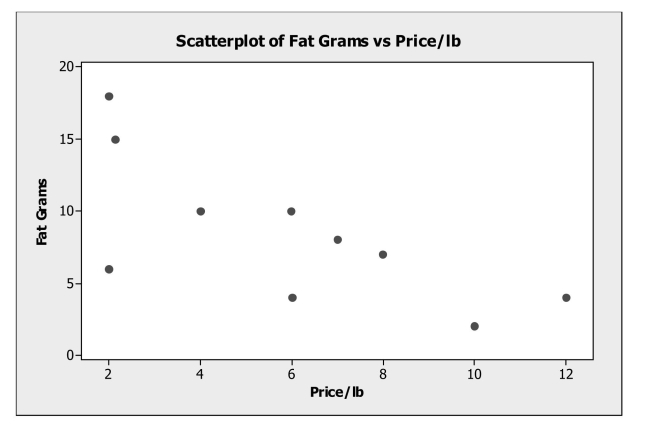
a. Describe the association between the price of meat and fat content.
b. Estimate the correlation.
c. If the point in the lower left hand corner ($2.00 per pound, 6 grams of fat) is removed,would the correlation become stronger or weaker or remain the same? Explain.
Correct Answer:
Verified
b.-.719, ...
View Answer
Unlock this answer now
Get Access to more Verified Answers free of charge
Q13: Consider the following to answer the question(s)
Q13: Consider the following to answer the question(s)
Q16: Analyze scatterplots and correlation coefficients.
-The scatterplot shows
Q17: For each of the following scenarios indicate
Q18: Consider the following to answer the question(s)
Q21: Analyze residuals.
-Linear regression was used to describe
Q22: Write and interpret a linear regression
Q23: Analyze scatterplots and correlation coefficients.
-For the scatterplot
Q24: Interpret a linear regression equation and use
Q25: Interpret the value of correlation coefficients
Unlock this Answer For Free Now!
View this answer and more for free by performing one of the following actions

Scan the QR code to install the App and get 2 free unlocks

Unlock quizzes for free by uploading documents