Analyze residuals.
-Linear regression was used to describe the trend in world population over time.
Below is a plot of the residuals versus predicted values. What does the plot of residuals
Suggest? 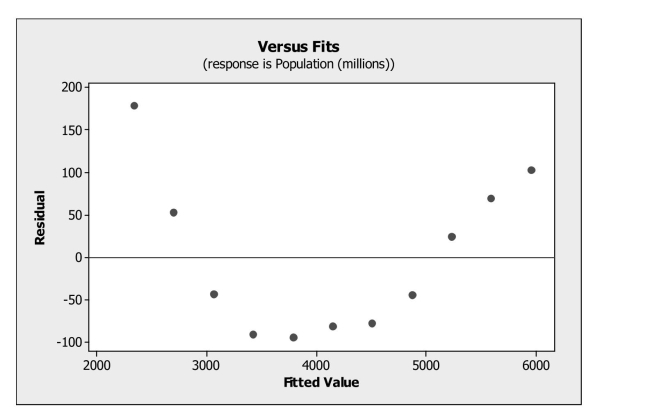
A) An outlier is present in the data set.
B) The linearity condition is not satisfied.
C) A high leverage point is present in the data set.
D) The data are not normal.
E) The equal spread condition is not satisfied.
Correct Answer:
Verified
Q13: Consider the following to answer the question(s)
Q16: Analyze scatterplots and correlation coefficients.
-The scatterplot shows
Q17: For each of the following scenarios indicate
Q18: Consider the following to answer the question(s)
Q20: A consumer research group investigating the relationship
Q22: Write and interpret a linear regression
Q23: Analyze scatterplots and correlation coefficients.
-For the scatterplot
Q24: Interpret a linear regression equation and use
Q25: Interpret the value of correlation coefficients
Q26: Interpret the value of correlation coefficients
Unlock this Answer For Free Now!
View this answer and more for free by performing one of the following actions

Scan the QR code to install the App and get 2 free unlocks

Unlock quizzes for free by uploading documents