The box plot shown below was constructed for the amount of soda that was poured by a filling machine into 12-ounce soda cans at a local soda bottling company. 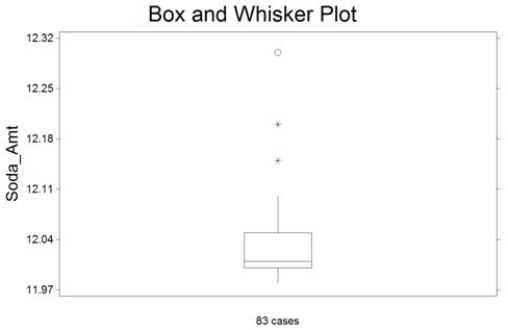 We see that one soda can received 12.15 ounces of soda on the plot above. Based on the box plot presented, how would you classify this observation?
A) expected observation
B) suspect outlier
C) highly suspect outlier
D) it has a lot of soda
Correct Answer:
Verified
Q182: Explain how stretching the vertical axis of
Q183: Explain how using a scale break on
Q184: Scatterplots are useful for both qualitative and
Q184: The box plot shown below displays the
Q185: The box plot shown below was constructed
Q186: Explain how it can be misleading to
Q188: Use a graphing calculator or software
Q191: A sample of professional golfers was taken
Q192: The scatterplot below shows a negative relationship
Q194: The data below represent the numbers
Unlock this Answer For Free Now!
View this answer and more for free by performing one of the following actions

Scan the QR code to install the App and get 2 free unlocks

Unlock quizzes for free by uploading documents