A sample of professional golfers was taken and their driving distance (measured as the average distance as their drive off the tee) and driving accuracy (measured as the percentage of fairways that their drives landed in) were recorded. A scatterplot of the variables is shown below. 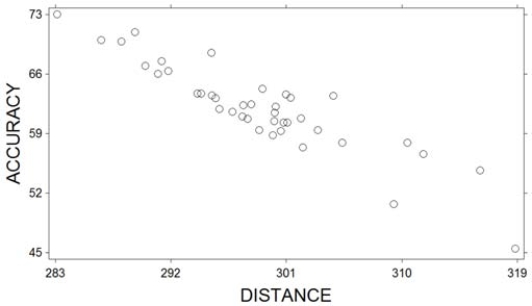 What relationship do these two variables exhibit?
A) They exhibit no relationship
B) They exhibit a positive linear relationship
C) They exhibit a negative linear relationship
D) They exhibit a curvillinear relationship
Correct Answer:
Verified
Q182: Explain how stretching the vertical axis of
Q183: Explain how using a scale break on
Q184: Scatterplots are useful for both qualitative and
Q184: The box plot shown below displays the
Q185: The box plot shown below was constructed
Q186: Explain how it can be misleading to
Q188: Use a graphing calculator or software
Q192: The scatterplot below shows a negative relationship
Q193: The box plot shown below was constructed
Q194: The data below represent the numbers
Unlock this Answer For Free Now!
View this answer and more for free by performing one of the following actions

Scan the QR code to install the App and get 2 free unlocks

Unlock quizzes for free by uploading documents