The side-by-side boxplots show the cumulative college GPAs for sophomores, juniors, and seniors taking an intro stats course in Autumn 2012.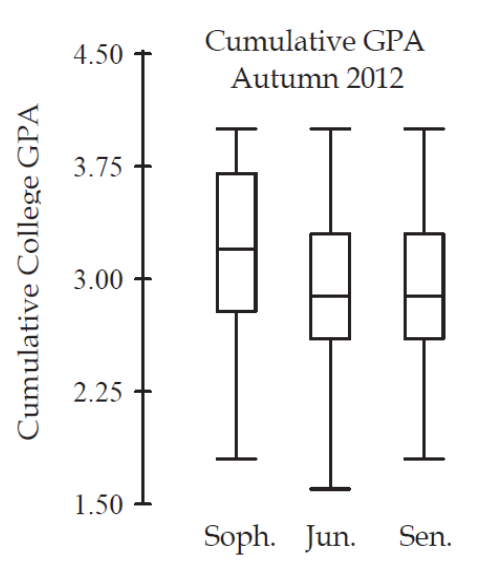
a.Which class (sophomore, junior, or senior) had the lowest cumulative college GPA?
What is the approximate value of that GPA?
b.Which class has the highest median GPA, and what is that GPA?
c.Which class has the largest range for GPA, and
what is it?
d.Which class has the most symmetric set of GPAs?
The most skewed set of GPAs?
Correct Answer:
Verified
Q1: The side-by-side boxplots show the cumulative college
Q3: At www.census.gov you can create a "population
Q4: On the right are two dotplots made
Q5: One thousand students from a local university
Q6: The boxplots show prices of used cars
Q7: The side-by-side boxplots show the cumulative college
Q8: A few of the male students are
Q9: The side-by-side boxplots show the cumulative college
Q10: The following boxplots show monthly sales revenue
Q11: The following boxplots show monthly sales revenue
Unlock this Answer For Free Now!
View this answer and more for free by performing one of the following actions

Scan the QR code to install the App and get 2 free unlocks

Unlock quizzes for free by uploading documents