This double-bar graph shows the number of male (M) and female (F) athletes at a university over a four-year period.
Answer the question. 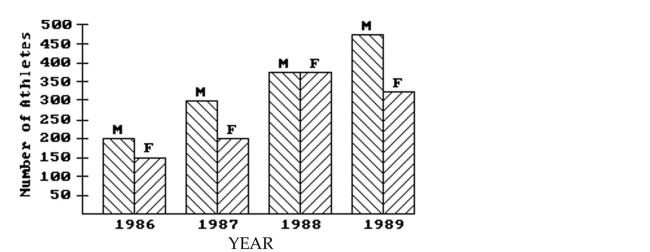
-What percentage of all students involved in athletics in 1986 was female? (Round to the nearest percent.)
A) 57%
B) 43%
C) 75%
D) 14%
Correct Answer:
Verified
Q52: This double-bar graph shows the number of
Q53: In a school survey, students showed these
Q54: In a school survey, students showed these
Q55: In a school survey, students showed these
Q56: In a school survey, students showed these
Q58: In a school survey, students showed these
Q59: This double-bar graph shows the number of
Q60: In a school survey, students showed these
Q61: Use the graph to answer the question.
-
Q62: Use the graph to answer the question.
-
Unlock this Answer For Free Now!
View this answer and more for free by performing one of the following actions

Scan the QR code to install the App and get 2 free unlocks

Unlock quizzes for free by uploading documents