This double-bar graph shows the number of male (M) and female (F) athletes at a university over a four-year period.
Answer the question. 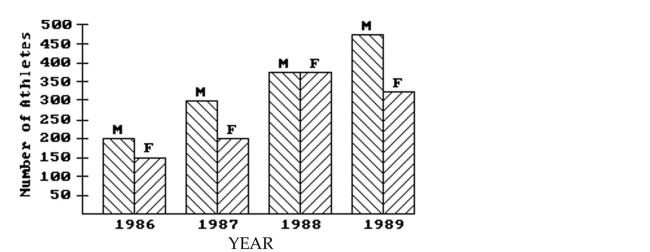
-Has the total number of students involved in athletics increased each year?
A) Yes.
B) No.
Correct Answer:
Verified
Q47: In a school survey, students showed these
Q48: This double-bar graph shows the number of
Q49: This double-bar graph shows the number of
Q50: This double-bar graph shows the number of
Q51: Use the information to complete a
Q53: In a school survey, students showed these
Q54: In a school survey, students showed these
Q55: In a school survey, students showed these
Q56: In a school survey, students showed these
Q57: This double-bar graph shows the number of
Unlock this Answer For Free Now!
View this answer and more for free by performing one of the following actions

Scan the QR code to install the App and get 2 free unlocks

Unlock quizzes for free by uploading documents