Construct and interpret a boxplot or a modified boxplot as specified.
-The test scores of 40 students are listed below. Construct a boxplot for the data.
A) 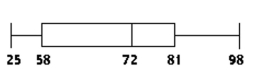
The data is left-skewed.
B) 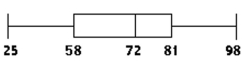
The data is slightly left-skewed.
C) 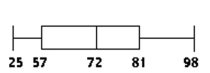
The data is fairly symmetrical.
D) 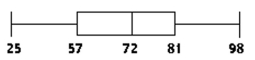
The data is slightly left-skewed.
Correct Answer:
Verified
Q64: Solve the problem. If necessary, round
Q65: Construct and interpret a boxplot or
Q66: Identify potential outliers, if any, for
Q67: Obtain the population standard deviation, Ϭ,
Q68: Find the mode(s)for the given sample
Q70: Find the median for the given
Q71: Solve the problem. If necessary, round
Q72: Determine the quartile or interquartile range
Q73: To get the best deal on
Q74: Identify potential outliers, if any, for
Unlock this Answer For Free Now!
View this answer and more for free by performing one of the following actions

Scan the QR code to install the App and get 2 free unlocks

Unlock quizzes for free by uploading documents