Construct and interpret a boxplot or a modified boxplot as specified.
-The weights (in pounds) of 30 newborn babies are listed below. Construct a boxplot for the data.
A) 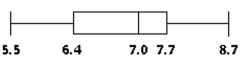
The data is left-skewed.
B) 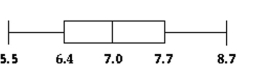
The data is highly symmetrical. It is a uniform distribution.
C) 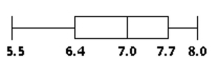
The data is slightly left-skewed.
D) 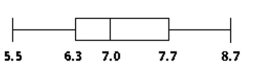
The data is slightly right-skewed.
Correct Answer:
Verified
Q60: Solve the problem.
-Here are boxplots of the
Q61: A variable x has a mean,
Q62: Find the median for the given sample
Q63: The normal annual precipitation (in inches)is
Q64: Solve the problem. If necessary, round
Q66: Identify potential outliers, if any, for
Q67: Obtain the population standard deviation, Ϭ,
Q68: Find the mode(s)for the given sample
Q69: Construct and interpret a boxplot or
Q70: Find the median for the given
Unlock this Answer For Free Now!
View this answer and more for free by performing one of the following actions

Scan the QR code to install the App and get 2 free unlocks

Unlock quizzes for free by uploading documents