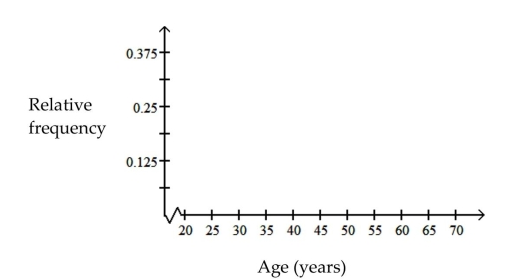
The table contains the frequency and relative-frequency distributions for the ages of the employees in a particular company department. 
Correct Answer:
Verified
Q2: Construct the requested histogram.
-The table below
Q3: Use cutpoint grouping to organize these
Q4: Use cutpoint grouping to organize these
Q5: A television manufacturer sold three times as
Q6: Given the following "data scenario," decide which
Q7: The bar graph below shows the average
Q8: Use cutpoint grouping to organize these
Q9: Given the following "data scenario," decide which
Q10: Maria constructed the frequency distribution shown
Q11: When organizing data into tables, what is
Unlock this Answer For Free Now!
View this answer and more for free by performing one of the following actions

Scan the QR code to install the App and get 2 free unlocks

Unlock quizzes for free by uploading documents