Construct a dotplot for the given data.
-The following data represent the number of cars passing through a toll booth during a certain time period over a number of days. 
A) 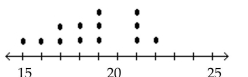
B) 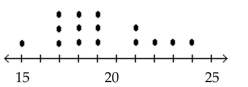
C) 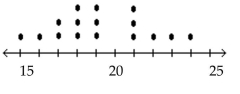
D) 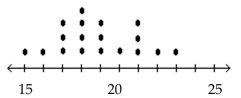
Correct Answer:
Verified
Q56: Construct a relative-frequency polygon for the given
Q57: Construct the requested histogram.
-The table gives
Q58: Provide an appropriate response.
-A population has a
Q59: Raul set up a frequency distribution
Q60: Scott Tarnowski owns a pet grooming
Q62: Complete the contingency table and use it
Q63: Complete the contingency table and use
Q64: Construct a pie chart representing the
Q65: Construct a dotplot for the given
Q66: The set of possible values that a
Unlock this Answer For Free Now!
View this answer and more for free by performing one of the following actions

Scan the QR code to install the App and get 2 free unlocks

Unlock quizzes for free by uploading documents