Construct a pie chart representing the given data set.
-The following data give the distribution of the types of houses in a town containing 26,000 houses. 
A) 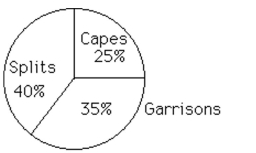
B) 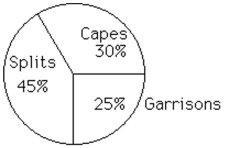
Correct Answer:
Verified
Q59: Raul set up a frequency distribution
Q60: Scott Tarnowski owns a pet grooming
Q61: Construct a dotplot for the given
Q62: Complete the contingency table and use it
Q63: Complete the contingency table and use
Q65: Construct a dotplot for the given
Q66: The set of possible values that a
Q67: Construct a dotplot for the given
Q68: A graphical display of a data set
Q69: A graphical display of a data
Unlock this Answer For Free Now!
View this answer and more for free by performing one of the following actions

Scan the QR code to install the App and get 2 free unlocks

Unlock quizzes for free by uploading documents