Construct a dotplot for the given data.
-The frequency chart shows the distribution of defects for the machines used to produce a product.
A) 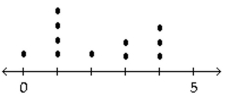
B) 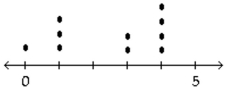
C) 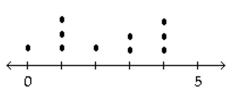
D) 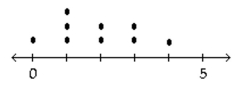
Correct Answer:
Verified
Q18: Determine which of the four levels of
Q85: Classify the data as either qualitative
Q86: A variable whose values are observed by
Q87: Construct a pie chart representing the
Q89: Complete the contingency table and use
Q91: The temperature in Manhattan at 1 p.m.
Q92: A graphical display of a data set
Q93: A graphical display of a data set
Q94: Use single-value grouping to organize these
Q95: The data in the following table
Unlock this Answer For Free Now!
View this answer and more for free by performing one of the following actions

Scan the QR code to install the App and get 2 free unlocks

Unlock quizzes for free by uploading documents