A graphical display of a data set is given. State whether the distribution is (roughly) symmetric, right skewed, or leftskewed.
-A relative frequency histogram for the sale prices of homes sold in one city during 2006 is shown below. 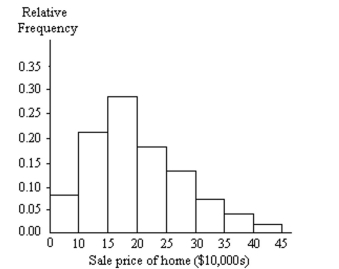
A) Left skewed
B) Symmetric
C) Right skewed
Correct Answer:
Verified
Q18: Determine which of the four levels of
Q87: Construct a pie chart representing the
Q89: Complete the contingency table and use
Q90: Construct a dotplot for the given
Q91: The temperature in Manhattan at 1 p.m.
Q93: A graphical display of a data set
Q94: Use single-value grouping to organize these
Q95: The data in the following table
Q96: A graphical display of a data set
Q97: A graphical display of a data set
Unlock this Answer For Free Now!
View this answer and more for free by performing one of the following actions

Scan the QR code to install the App and get 2 free unlocks

Unlock quizzes for free by uploading documents