A graphical display of a data set is given. State whether the distribution is (roughly) symmetric, right skewed, or leftskewed.
-A die was rolled 200 times and a record was kept of the numbers obtained. The results are shown in the relative frequency histogram below. 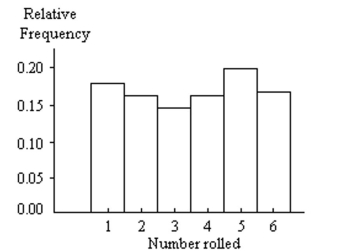
A) Left skewed
B) Right skewed
C) Symmetric
Correct Answer:
Verified
Q92: A graphical display of a data set
Q93: A graphical display of a data set
Q94: Use single-value grouping to organize these
Q95: The data in the following table
Q96: A graphical display of a data set
Q98: A variable whose possible values are 1.15,
Q99: Identify the variable.
-The following table gives
Q100: A discrete variable always yields numerical values.
Q101: The following table gives the top
Q102: A nurse measured the blood pressure of
Unlock this Answer For Free Now!
View this answer and more for free by performing one of the following actions

Scan the QR code to install the App and get 2 free unlocks

Unlock quizzes for free by uploading documents