A graphical display of a data set is given. Identify the overall shape of the distribution as (roughly) bell-shaped,triangular, uniform, reverse J-shaped, J-shaped, right skewed, left skewed, bimodal, or multimodal.
-A relative frequency histogram for the heights of a sample of adult women is shown below. 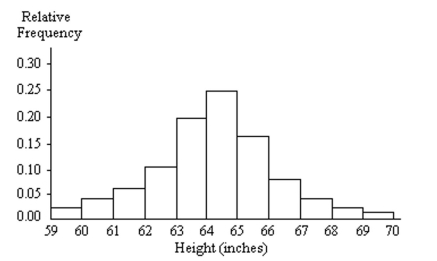
A) J-shaped
B) Triangular
C) Bell-shaped
D) Left skewed
Correct Answer:
Verified
Q91: The temperature in Manhattan at 1 p.m.
Q92: A graphical display of a data set
Q93: A graphical display of a data set
Q94: Use single-value grouping to organize these
Q95: The data in the following table
Q97: A graphical display of a data set
Q98: A variable whose possible values are 1.15,
Q99: Identify the variable.
-The following table gives
Q100: A discrete variable always yields numerical values.
Q101: The following table gives the top
Unlock this Answer For Free Now!
View this answer and more for free by performing one of the following actions

Scan the QR code to install the App and get 2 free unlocks

Unlock quizzes for free by uploading documents