Multiple Choice
The following table presents the purchase totals (in dollars) of a random sample of gasoline purchases at a convenience store.
Construct a relative frequency histogram using a class width of 10, and using 0 as the lower class
Limit for the first class.
A) 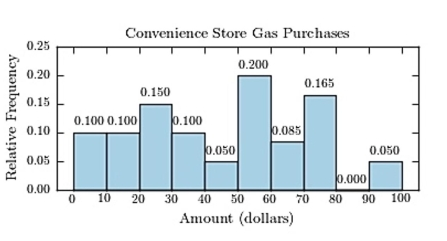
B) 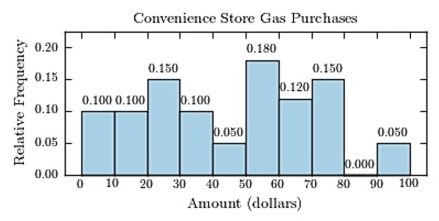
C) 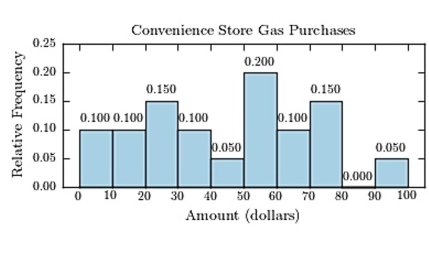 D)
D) 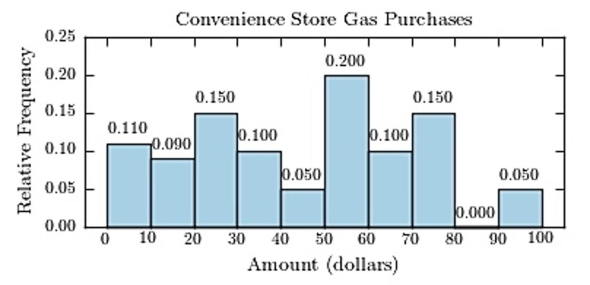
Correct Answer:
Verified
Related Questions
Q48: The frequency polygon is a graph that
Q49: Using the ogive shown below, what is
Q50: The following table presents the purchase
Unlock this Answer For Free Now!
View this answer and more for free by performing one of the following actions

Scan the QR code to install the App and get 2 free unlocks

Unlock quizzes for free by uploading documents