The following table presents the purchase totals (in dollars) of a random sample of gasolis purchases at a convenience store.
Construct a frequency histogram using a class width of 10 , and using 0 as the lower class the first class.
A) 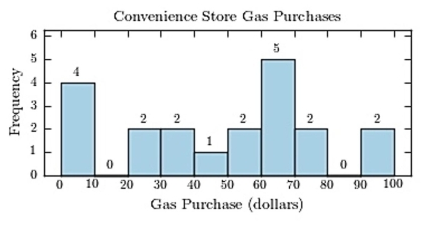
B) 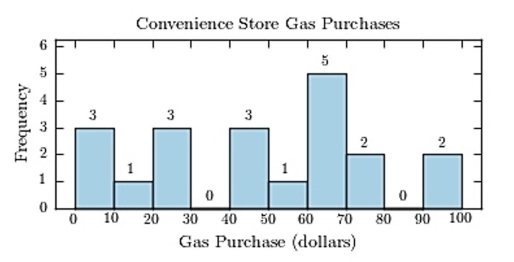
C) 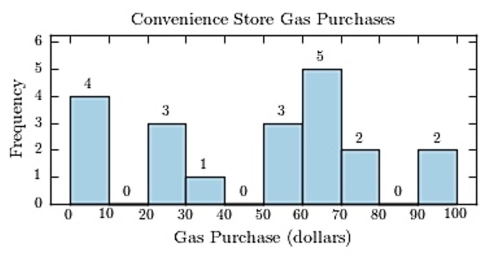
D) 
Correct Answer:
Verified
Q53: The following table presents the purchase
Q54: A histogram is a graph that represents
Q55: For a given data set, the ogive
Q56: The following table presents the purchase
Q57: Graphs that show distributions using proportions instead
Q59: Which of the following is a histogram?
A)
Q60: If the graph of a frequency distribution
Q61: A sample of 200 high school
Unlock this Answer For Free Now!
View this answer and more for free by performing one of the following actions

Scan the QR code to install the App and get 2 free unlocks

Unlock quizzes for free by uploading documents