Multiple Choice
A sample of 200 high school students were asked how many hours per week they spend u television. The following frequency distribution presents the results.
Construct a relative frequency ogive for the frequency distribution. watching
A) 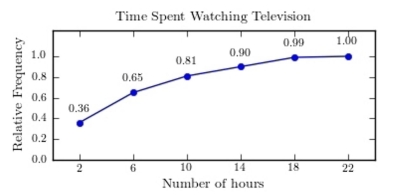
B) 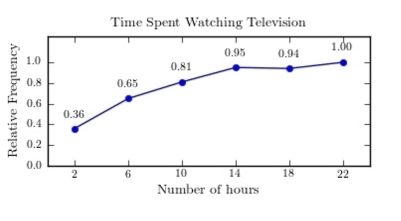
C) 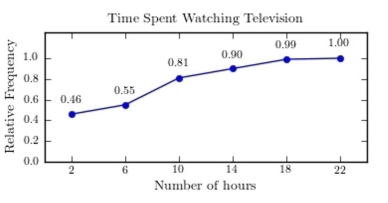
D) 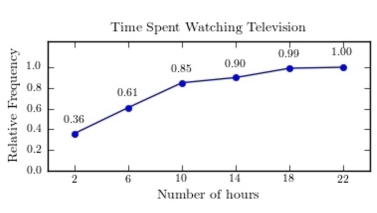
Correct Answer:
Verified
Related Questions
Q56: The following table presents the purchase
Q57: Graphs that show distributions using proportions instead
Q58: The following table presents the purchase
Q59: Which of the following is a histogram?
A)
Q60: If the graph of a frequency distribution
Unlock this Answer For Free Now!
View this answer and more for free by performing one of the following actions

Scan the QR code to install the App and get 2 free unlocks

Unlock quizzes for free by uploading documents