Multiple Choice
The following pie chart presents the percentages of fish caught in each of four ratings cate
Match this pie chart with its corresponding Parato chart.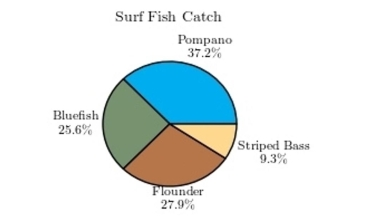
A) 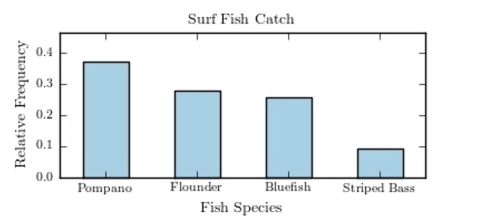
B) 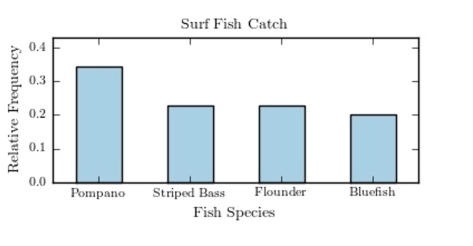
gories.
C) 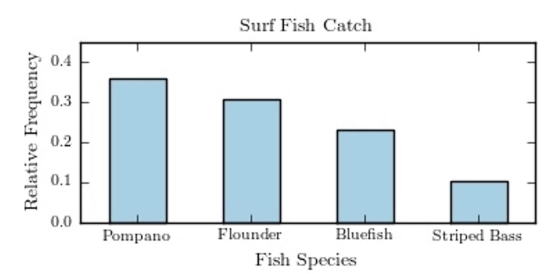
D) 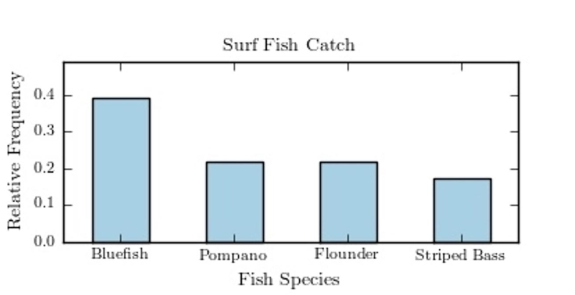
Correct Answer:
Verified
Related Questions
Q61: A sample of 200 high school
Q62: Q63: The following frequency distribution presents the Q64: Karen is constructing a pie graph Q65: Thirty households were surveyed for the Q67: A sample of 200 high school Q68: Thirty households were surveyed for the Q69: 
Unlock this Answer For Free Now!
View this answer and more for free by performing one of the following actions

Scan the QR code to install the App and get 2 free unlocks

Unlock quizzes for free by uploading documents