Construct a pie chart representing the given data set.
-The following data give the distribution of the types of houses in a town containing 43,000 houses.

A) 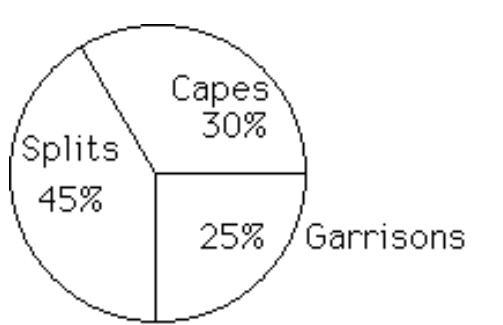
B) 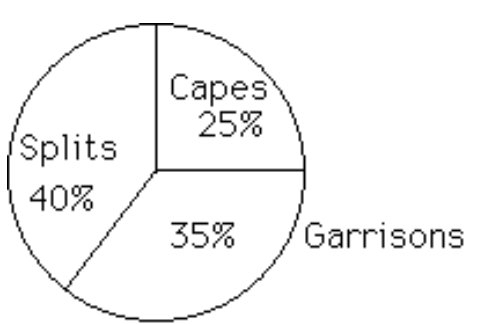
Correct Answer:
Verified
Q65: The frequency distribution below summarizes employee
Q66: The following frequency distribution analyzes the
Q67: The following data show the number
Q68: The histogram below represents the number of
Q69: The frequency distribution for the weekly
Q71: The frequency distribution below summarizes the
Q72: A nurse measured the blood pressure of
Q73: The histogram below represents the number of
Q74: The ages of the 45 members
Q75: Construct a pie chart representing the
Unlock this Answer For Free Now!
View this answer and more for free by performing one of the following actions

Scan the QR code to install the App and get 2 free unlocks

Unlock quizzes for free by uploading documents