The histogram below represents the number of television sets per household for a sample of U.S. households. What is the minimum number of households having the same number of television sets? 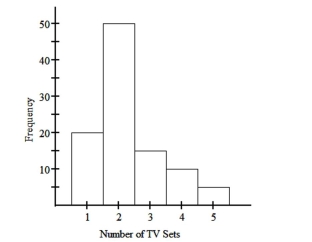
A) 20
B) 1
C) 100
D) 5
Correct Answer:
Verified
Q68: The histogram below represents the number of
Q69: The frequency distribution for the weekly
Q70: Construct a pie chart representing the
Q71: The frequency distribution below summarizes the
Q72: A nurse measured the blood pressure of
Q74: The ages of the 45 members
Q75: Construct a pie chart representing the
Q76: Use the given paired data to
Q77: Construct a pie chart representing the
Q78: Construct the cumulative frequency distribution that
Unlock this Answer For Free Now!
View this answer and more for free by performing one of the following actions

Scan the QR code to install the App and get 2 free unlocks

Unlock quizzes for free by uploading documents