Use the given paired data to construct a scatterplot.
- 
A) 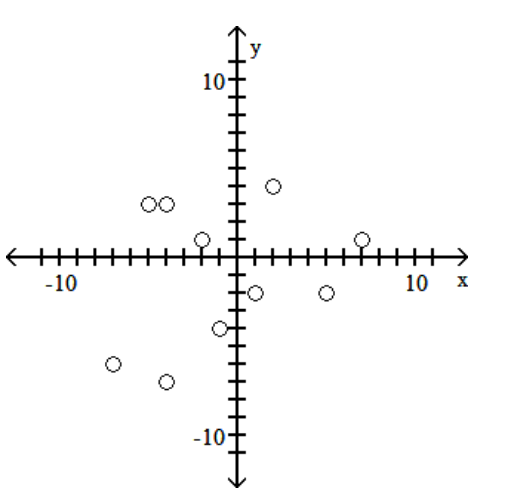
B) 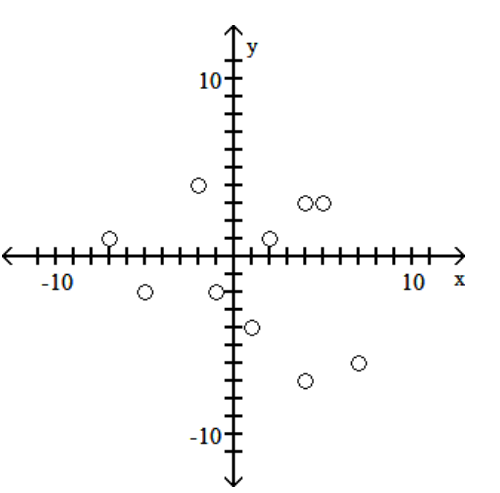
C) 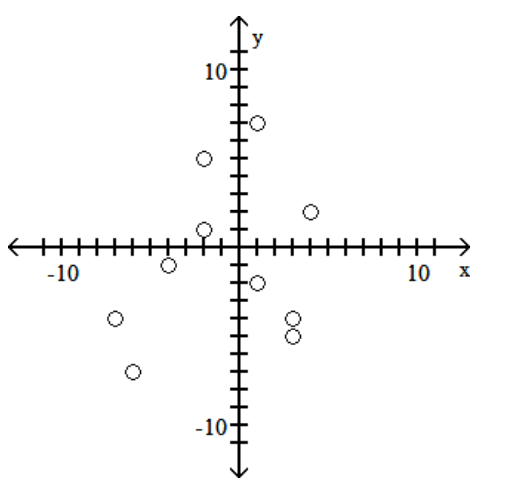
D) 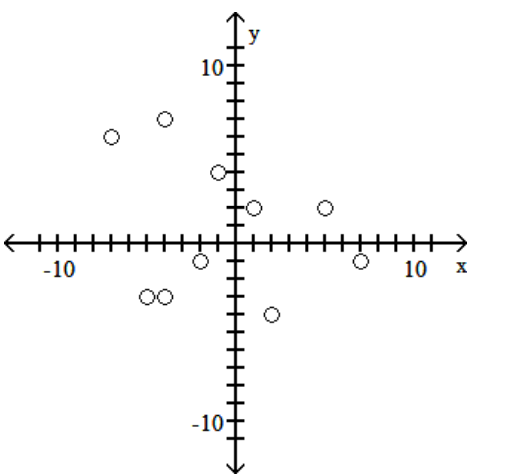
Correct Answer:
Verified
Q71: The frequency distribution below summarizes the
Q72: A nurse measured the blood pressure of
Q73: The histogram below represents the number of
Q74: The ages of the 45 members
Q75: Construct a pie chart representing the
Q77: Construct a pie chart representing the
Q78: Construct the cumulative frequency distribution that
Q79: The following frequency distribution analyzes the
Q80: The histogram below represents the number of
Q81: The frequency distribution below summarizes the
Unlock this Answer For Free Now!
View this answer and more for free by performing one of the following actions

Scan the QR code to install the App and get 2 free unlocks

Unlock quizzes for free by uploading documents