Construct a pie chart representing the given data set.
-After reviewing a movie, 700 people rated the movie as excellent, good, or fair. The following data give the rating distribution.

A) 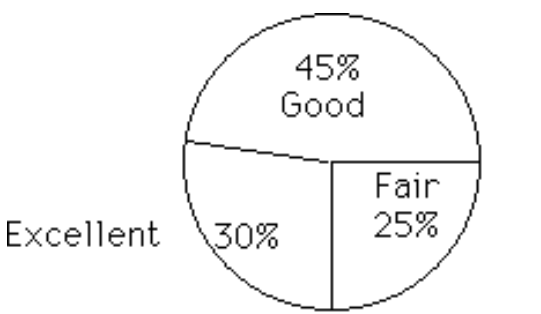
B) 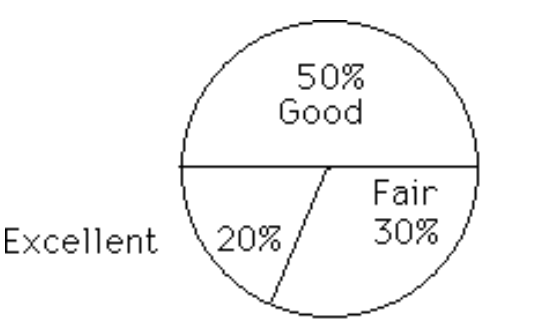
Correct Answer:
Verified
Q72: A nurse measured the blood pressure of
Q73: The histogram below represents the number of
Q74: The ages of the 45 members
Q75: Construct a pie chart representing the
Q76: Use the given paired data to
Q78: Construct the cumulative frequency distribution that
Q79: The following frequency distribution analyzes the
Q80: The histogram below represents the number of
Q81: The frequency distribution below summarizes the
Q82: Use the data to create a
Unlock this Answer For Free Now!
View this answer and more for free by performing one of the following actions

Scan the QR code to install the App and get 2 free unlocks

Unlock quizzes for free by uploading documents