Nine adults were selected at random from among those working full time in the town of Workington.
Each person was asked the number of years of college education they had completed and was also asked to rate their job satisfaction on a scale of 1 to 10.
The pairs of data values area plotted in the scatterplot below. 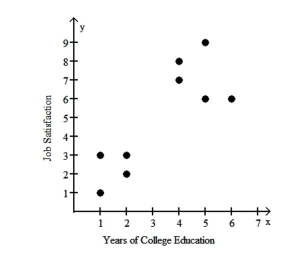
The four points in the lower left corner correspond to employees from company A and the five points in the upper right corner correspond to employees from company B.
a. Using the pairs of values for all 9 points, find the equation of the regression line.
b. Using only the pairs of values for the four points in the lower left corner, find the equation of the regression line.
c. Using only the pairs of values for the five points in the upper right corner, find the equation of the regression line.
d. Compare the results from parts a, b, and c.
Correct Answer:
Verified
b.
c.
d. The results are...
View Answer
Unlock this answer now
Get Access to more Verified Answers free of charge
Q2: Describe the rank correlation test. What types
Q14: Determine which scatterplot shows the strongest linear
Q15: Explain what is meant by the
Q19: The sample data below are the
Q20: For the data below, determine the
Q21: Ten trucks were ranked according to
Q23: Use the rank correlation coefficient to
Q31: Describe the error in the stated conclusion.
-Given:
Q46: Suppose there is significant correlation between two
Q49: Define the terms predictor variable and response
Unlock this Answer For Free Now!
View this answer and more for free by performing one of the following actions

Scan the QR code to install the App and get 2 free unlocks

Unlock quizzes for free by uploading documents