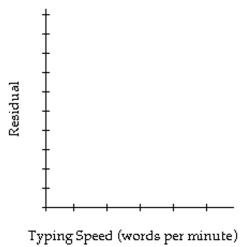
The sample data below are the typing speeds (in words per minute) and reading speeds (in words per minute) of nine randomly selected secretaries. Here, x denotes typing speed, and y denotes reading speed.
The regression equation was obtained. Construct a residual plot for the data.
Correct Answer:
Verified
Q14: Determine which scatterplot shows the strongest linear
Q15: Explain what is meant by the
Q18: Nine adults were selected at random from
Q20: For the data below, determine the
Q21: Ten trucks were ranked according to
Q23: Use the rank correlation coefficient to
Q31: Describe the error in the stated conclusion.
-Given:
Q46: Suppose there is significant correlation between two
Q49: Define the terms predictor variable and response
Q55: Describe what scatterplots are and discuss the
Unlock this Answer For Free Now!
View this answer and more for free by performing one of the following actions

Scan the QR code to install the App and get 2 free unlocks

Unlock quizzes for free by uploading documents