Cats and dogs The table shows whether students in an introductory statistics class like
dogs and/or cats. 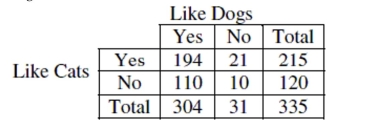
a. What is the marginal distribution (in %) of "liking dogs"?
b. What is the conditional distribution (in %) of "liking dogs" for students who like cats?
c. What kind of display(s) would you use to examine the association between "liking dogs"
and "liking cats"? (Just name a graph.)
d. Do "liking dogs" and "liking cats" appear to be independent? Give statistical evidence to
support your conclusion.
Correct Answer:
Verified
b. Yes: 90.2% No:...
View Answer
Unlock this answer now
Get Access to more Verified Answers free of charge
Q72: Soda cans A machine that fills cans
Q748: Suppose that a Normal model describes fuel
Q750: Commuting to work The table shows how
Q751: Last weekend police ticketed 18 men whose
Q752: The five-number summary of credit hours
Q754: If we want to discuss any gaps
Q755: Suppose that a Normal model described
Q756: The veterinary bills for the dogs are
Q757: The advantage of making a stem-and-leaf display
Q758: Which is true of the data shown
Unlock this Answer For Free Now!
View this answer and more for free by performing one of the following actions

Scan the QR code to install the App and get 2 free unlocks

Unlock quizzes for free by uploading documents