Commuting to work The table shows how a company's employees commute to work. 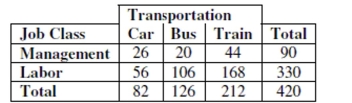
a. What is the marginal distribution (in %) of mode of transportation (Car, Bus, Train)?
b. What is the conditional distribution (in %) of mode of transportation (Car, Bus, Train) for
management?
c. What kind of display would you use to show the association between job class and mode
of transportation? (Just name a graph.)
d. Do job classification and mode of transportation appear to be independent? Give
statistical evidence to support your conclusion.
Correct Answer:
Verified
b. C...
View Answer
Unlock this answer now
Get Access to more Verified Answers free of charge
Q72: Soda cans A machine that fills cans
Q745: House calls A local plumber makes
Q746: Suppose a Normal model describes the number
Q747: The best estimate of the standard deviation
Q748: Suppose that a Normal model describes fuel
Q751: Last weekend police ticketed 18 men whose
Q752: The five-number summary of credit hours
Q753: Cats and dogs The table shows whether
Q754: If we want to discuss any gaps
Q755: Suppose that a Normal model described
Unlock this Answer For Free Now!
View this answer and more for free by performing one of the following actions

Scan the QR code to install the App and get 2 free unlocks

Unlock quizzes for free by uploading documents