Which of the following statements best describes the distribution and variability of the histogram below? The data in the histogram summarizes length of time on hold for a collection of customers calling a repair call center. 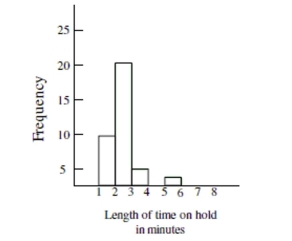
A) The distribution shows that the data was highly variable with some callers waiting on hold as many as 20 minutes.
B) The distribution is left-skewed and most callers waited on hold at least three minutes.
C) The distribution is symmetrical. The number of callers who waited on hold for less than three minutes was the same as the number of callers who waited on hold for more than three minutes.
D) The distribution is right-skewed and most callers waited on hold less than three minutes.
Correct Answer:
Verified
Q33: Which of the following statements about bar
Q33: The distribution of test scores for a
Q34: Based on the histogram below, would it
Q36: Choose the histogram that matches the description.
-The
Q37: The histogram shows the distribution of pitch
Q39: Find the original data set from
Q40: Choose the histogram that matches the description.
-The
Q43: According to the histogram, about how many
Q44: Compare and describe the shape of the
Q58: You have created a histogram showing the
Unlock this Answer For Free Now!
View this answer and more for free by performing one of the following actions

Scan the QR code to install the App and get 2 free unlocks

Unlock quizzes for free by uploading documents