Choose the histogram that matches the description.
-The data in the histogram summarizes the pitch speed of a sample of 75 pitches for a college pitcher during one season. Which of the following statements best describes the distribution of the Histogram below? 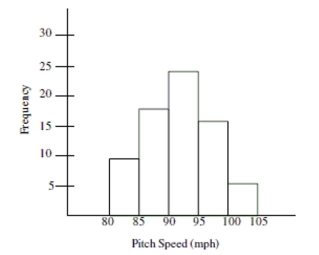
A) The distribution is right-skewed and shows that most of the pitches were more than 90 mph.
B) The distribution has a large amount of variation which can be seen by comparing the heights of the bars in the histogram.
C) The distribution is left-skewed and shows that most of the pitches were less than 95 mph.
D) The distribution is symmetric around a pitch speed of about 93 mph.
Correct Answer:
Verified
Q21: Which of the following statements about bar
Q31: The distribution of the numbers of times
Q33: Which of the following statements about bar
Q33: The distribution of test scores for a
Q34: Based on the histogram below, would it
Q37: The histogram shows the distribution of pitch
Q38: Which of the following statements best describes
Q39: Find the original data set from
Q40: Choose the histogram that matches the description.
-The
Q44: Compare and describe the shape of the
Unlock this Answer For Free Now!
View this answer and more for free by performing one of the following actions

Scan the QR code to install the App and get 2 free unlocks

Unlock quizzes for free by uploading documents